A 500 from order-service can originate from a timeout several services downstream, wrapped and re-thrown before it reaches the client. Without request correlation, debugging means lining up timestamps across multiple log streams and guessing which entries belong to the same request.
Observability connects logs, metrics, and traces around a shared identifier that follows the request across every service boundary. When a request fails, the log entry links directly to the distributed trace and the related metrics.
This article walks through an observability setup for a mixed Java/Python stack running on Kubernetes:
- Spring Boot
- FastAPI
- LangChain
- OpenTelemetry
- Grafana LGTM (Loki, Grafana, Tempo, Prometheus)
The reference project includes three deployable services plus a Makefile that boots the entire environment on Minikube with a single command.
The three pillars and the thread between them
Logs, metrics, and traces each address a different part of the debugging problem. What connects all three is a shared identifier that follows the request across every service boundary.
Logs capture detailed events inside a service: requests, errors, downstream calls, retries, decisions. In a microservice architecture every service writes independently, so once a request crosses multiple services its path cannot be reconstructed from logs alone.
Metrics give us aggregated system behavior over time: throughput, latency, error rates, saturation. They tell us that something is wrong and often where to start looking, but not which request triggered the problem.
Traces follow a single request end-to-end through the system. A distributed trace records each service hop, downstream HTTP call, and internal span, together with timing and metadata, and carries the correlation ID.
In this stack, OpenTelemetry generates a unique trace_id for every incoming request. That ID is:
- propagated automatically to every downstream HTTP call via the W3C
traceparentheader - injected into the logging context of every log line written during that request
- attached to every span in the distributed trace stored in Tempo
A Loki query like:
{namespace="apps"} | json | traceId="4bf92f35..."
returns every log line, from every service, for that specific request. A single click on the traceId field opens the full Tempo trace.
Stack choice: LGTM + OpenTelemetry
The Elastic Stack was the standard and is still a solid option, but for Kubernetes workloads the Grafana LGTM stack tends to be lighter and easier to operate.
Two aspects are particularly relevant here.
First, Elasticsearch moved to the SSPL license in 2021, which is not recognized as OSI open source and introduces additional constraints for self-hosting scenarios. In contrast, the entire LGTM stack is released under Apache 2.0.
Second, Loki indexes labels rather than the full log content, significantly reducing resource consumption for structured logging workloads. In use cases where queries are primarily based on fields such as traceId or level, this approach provides a much smaller operational footprint without meaningful limitations.
The four components of this stack:
- OpenTelemetry Collector: receives OTLP spans from all services, batches and forwards them to Tempo. Deployed as a Kubernetes
Deploymentin theobservabilitynamespace. - Grafana Tempo: stores and queries distributed traces. Accepts OTLP gRPC on port 4317.
- Grafana Loki + Promtail: Promtail runs as a
DaemonSetand scrapes Kubernetes pod logs; Loki extracts thetraceIdfield as a label on ingest, enabling direct correlation with Tempo. - Prometheus + Grafana: Prometheus scrapes
/actuator/prometheus(Spring Boot) and/metrics(FastAPI) via pod annotations. Grafana is the unified UI for all three backends.
Architecture
The OTEL Collector is the only component the application services need to reach. Prometheus and Promtail pull from the services directly, so no sidecar is required.
Spring Boot’s OTLP exporter uses HTTP/protobuf on port 4318; the Python services use gRPC on 4317. The Collector accepts both, so mixed runtimes work without additional configuration.
The reference project
make all
cluster + infra + build + deploy in one shot
The cluster setup follows the pattern from the Minikube profiles article: each project gets its own named Minikube profile, its own kubectl context, and an exportable standalone kubeconfig. The make cluster-start target creates the observability-demo profile and automatically exports its context to ~/.kube/observability-demo.yaml.
# Full bootstrap — cluster + infra + build + deploy
make all

# Forward all UIs and service ports to localhost
make port-forward        # Grafana :3000  Prometheus :9090  services :8080–8082

# Generate traffic to produce traces, logs, and metrics
make seed                # 10 orders through the full chain

# Open k9s on this cluster
make k9s
# k9s --context observability-demo
# k9s --kubeconfig ~/.kube/observability-demo.yaml

# Per-session isolation
export KUBECONFIG=~/.kube/observability-demo.yaml
Every kubectl and helm command in the Makefile uses --context=observability-demo and --kube-context=observability-demo respectively, so the Makefile is safe to run regardless of which context is currently active in ~/.kube/config.
Instrumentation: Spring Boot
Spring Boot 3.x and Micrometer Tracing handle most of this automatically. Three dependencies suffice:
<!-- Bridges Micrometer's tracing API to the OpenTelemetry SDK -->
<dependency>
    <groupId>io.micrometer</groupId>
    <artifactId>micrometer-tracing-bridge-otel</artifactId>
</dependency>

<!-- Exports spans via OTLP HTTP/protobuf to the OTEL Collector -->
<dependency>
    <groupId>io.opentelemetry</groupId>
    <artifactId>opentelemetry-exporter-otlp</artifactId>
</dependency>

<!-- Exposes /actuator/prometheus for Prometheus scraping -->
<dependency>
    <groupId>io.micrometer</groupId>
    <artifactId>micrometer-registry-prometheus</artifactId>
</dependency>
With these on the classpath, application.yml points the exporter at the OTEL Collector and enables 100% sampling:
spring:
  application:
    name: order-service
  jackson:
    property-naming-strategy: SNAKE_CASE

management:
  tracing:
    sampling:
      probability: 1.0
  otlp:
    tracing:
      endpoint: http://${OTEL_COLLECTOR_HOST:otel-collector.observability.svc.cluster.local}:4318/v1/traces
  endpoints:
    web:
      exposure:
        include: health,prometheus
Port 4318 is OTLP over HTTP/protobuf, the transport Spring Boot’s exporter uses. Pointing it at the gRPC port 4317 fails silently: no exception, no timeout, and spans stop arriving in Tempo.
For structured JSON logs with the trace ID, logstash-logback-encoder reads the traceId and spanId keys that Micrometer Tracing writes to MDC automatically:
<appender name="CONSOLE" class="ch.qos.logback.core.ConsoleAppender">
    <encoder class="net.logstash.logback.encoder.LogstashEncoder">
        <customFields>{"service":"${appName}"}</customFields>
        <includeMdcKeyName>traceId</includeMdcKeyName>
        <includeMdcKeyName>spanId</includeMdcKeyName>
    </encoder>
</appender>
Every log line produced during a request now includes "traceId":"4bf92f35..." as a JSON field. Promtail extracts this as a Loki label on ingest, with no extra configuration on the application side.
HTTP trace propagation is also automatic. When order-service calls inventory-service via Spring’s RestClient, the auto-configured observation infrastructure injects the W3C traceparent header, with no manual header passing.
Instrumentation: FastAPI
The Python side needs more setup. Five packages cover tracing, metrics, and structured logging:
opentelemetry-sdk>=1.25.0
opentelemetry-instrumentation-fastapi>=0.46b0
opentelemetry-exporter-otlp-proto-grpc>=1.25.0
prometheus-fastapi-instrumentator>=6.1.0
structlog>=24.2.0
At startup, the tracer provider is initialized and the FastAPI app is instrumented:
from opentelemetry import trace
from opentelemetry.sdk.resources import Resource
from opentelemetry.sdk.trace import TracerProvider
from opentelemetry.sdk.trace.export import BatchSpanProcessor
from opentelemetry.exporter.otlp.proto.grpc.trace_exporter import OTLPSpanExporter
from opentelemetry.instrumentation.fastapi import FastAPIInstrumentor

resource = Resource.create({"service.name": SERVICE_NAME})
tracer_provider = TracerProvider(resource=resource)
tracer_provider.add_span_processor(
    BatchSpanProcessor(
        OTLPSpanExporter(endpoint=f"{OTEL_COLLECTOR_HOST}:4317", insecure=True)
    )
)
trace.set_tracer_provider(tracer_provider)

app = FastAPI()
FastAPIInstrumentor().instrument_app(app)
Unlike Spring Boot, the Python exporter uses gRPC on port 4317. The OTEL Collector accepts both; services don’t need to align on transport.
For structured logging with the correlation ID, structlog needs one custom processor that reads the active OTEL span context at log time:
import structlog
from opentelemetry import trace

def add_otel_context(logger, method, event_dict):
    span_context = trace.get_current_span().get_span_context()
    if span_context.is_valid:
        event_dict["traceId"] = format(span_context.trace_id, "032x")
        event_dict["spanId"]  = format(span_context.span_id,  "016x")
    return event_dict

structlog.configure(
    processors=[
        structlog.stdlib.add_log_level,
        structlog.processors.TimeStamper(fmt="iso"),
        add_otel_context,
        structlog.processors.JSONRenderer(),
    ],
    ...
)
The field name traceId must match what the Promtail pipeline stage extracts and what Spring Boot’s logstash-logback-encoder writes, with the same camelCase in every service. If any service drifts to trace_id or TraceId, Loki ends up with multiple label names and the Grafana correlation link breaks.
Custom spans are simple:
tracer = trace.get_tracer(SERVICE_NAME)

@app.get("/inventory/{product_id}")
async def get_inventory(product_id: str):
    with tracer.start_as_current_span("inventory.lookup") as span:
        span.set_attribute("product.id", product_id)
        # ... logic
The child span appears nested under the parent HTTP request span in Tempo, with its own duration and attributes.
Instrumentation: LangChain and agentic flows
LangChain operations (chain invocations, LLM calls, tool executions, agent steps) don’t appear in OpenTelemetry traces by default. OpenInference from Arize AI fills that gap with OTEL-compatible instrumentation for the LangChain execution graph:
openinference-instrumentation-langchain>=0.1.19
One call after setting the global tracer provider instruments everything:
from openinference.instrumentation.langchain import LangChainInstrumentor

trace.set_tracer_provider(tracer_provider)     # must come first
LangChainInstrumentor().instrument()
No other changes are needed. Every chain invocation now produces child spans under the parent request span. In Tempo, a trace for a /recommendations call looks like this:
HTTP POST /recommendations  (345ms)
  └─ langchain.recommend  (340ms)        ← custom span from the handler
       └─ langchain.chain  (335ms)       ← OpenInference
            ├─ langchain.llm  (310ms)    ← LLM call: prompt + completion + tokens
            └─ langchain.output_parser   (1ms)
With a real LLM (OpenAI, Anthropic), the langchain.llm span includes the full prompt, completion text, and token counts, all visible in Tempo without adding instrumentation code. The FakeListLLM in the reference project produces the same span structure, so the wiring is identical regardless of which model is plugged in.
The agent_trace_id field in the /recommendations response returns the current trace ID as a string, so clients can include it in bug reports or pass it to a support dashboard:
def _current_trace_id() -> str:
    span_context = trace.get_current_span().get_span_context()
    return format(span_context.trace_id, "032x") if span_context.is_valid else "0" * 32
How the correlation ID propagates
Every HTTP request entering order-service gets a trace_id generated at the edge. When order-service calls inventory-service, the outgoing request carries:
traceparent: 00-4bf92f3577b34da6a3ce929d0e0e4736-00f067aa0ba902b7-01
              │  │                               │               └─ flags
              │  └─ trace_id (128-bit hex)       └─ parent span_id (64-bit)
              └─ version
The receiving service reads this header automatically, extracts the trace_id, and continues the trace as a child span. The LangChain spans created by OpenInference are children of the FastAPI span. One trace_id runs from the first HTTP entry point through every service and every LLM call.
Structlog reads the trace_id from the active OTEL span context at the moment each log call is made. Every logger.info(...) inside a request handler includes it automatically, so the ID never needs to be passed through function arguments or thread-local state. Spring Boot’s MDC integration works the same way.
Navigating Grafana
Open http://localhost:3000 (admin / admin) after running make port-forward. Run make seed first to generate traces and logs to explore.
Following a request end to end:
Loki. In the query field type {namespace="apps", app="order-service"} and run the query. The log stream from the order service shows up.
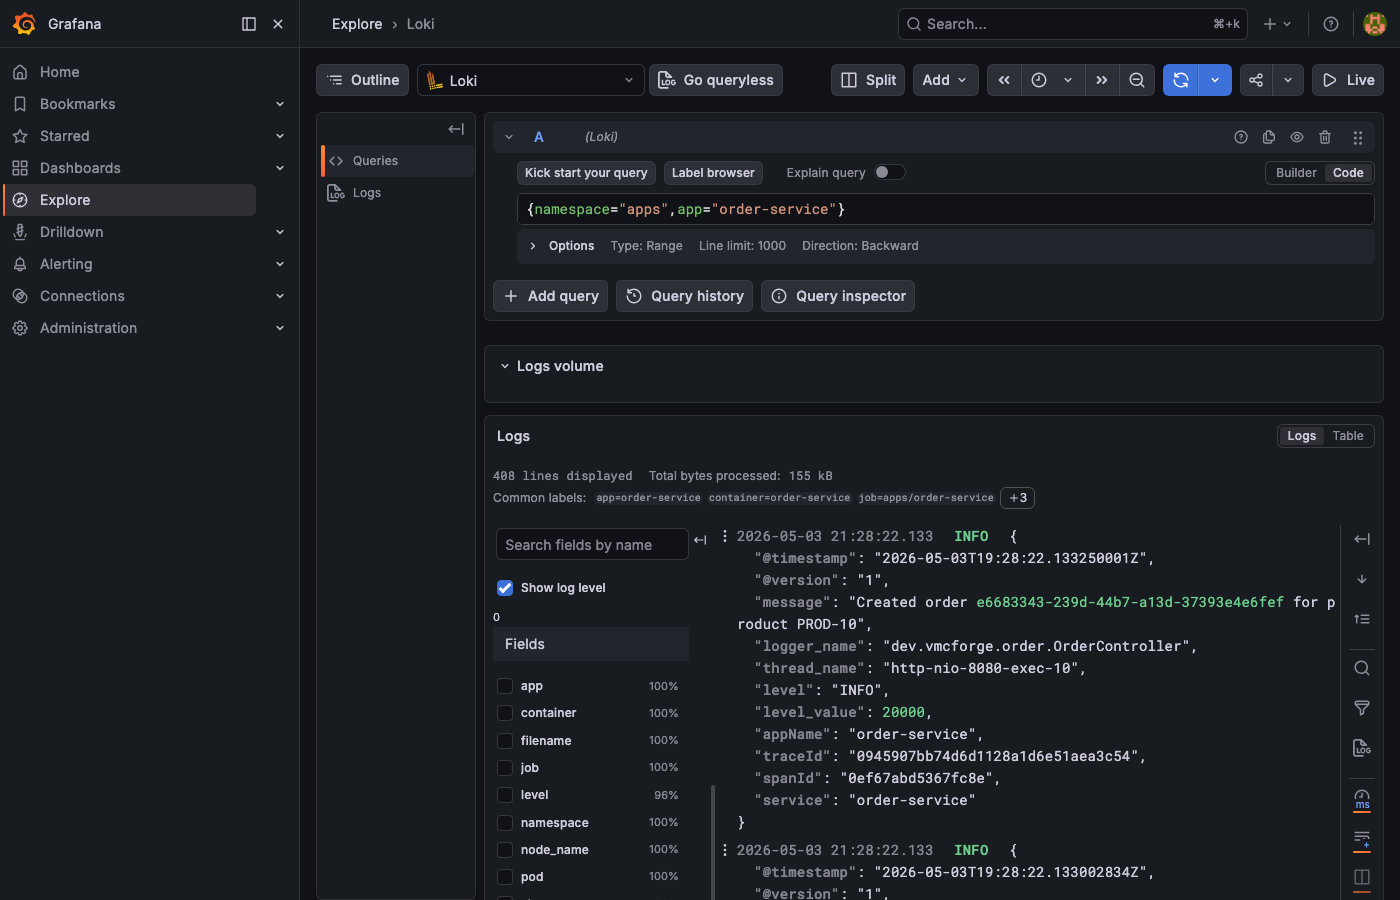
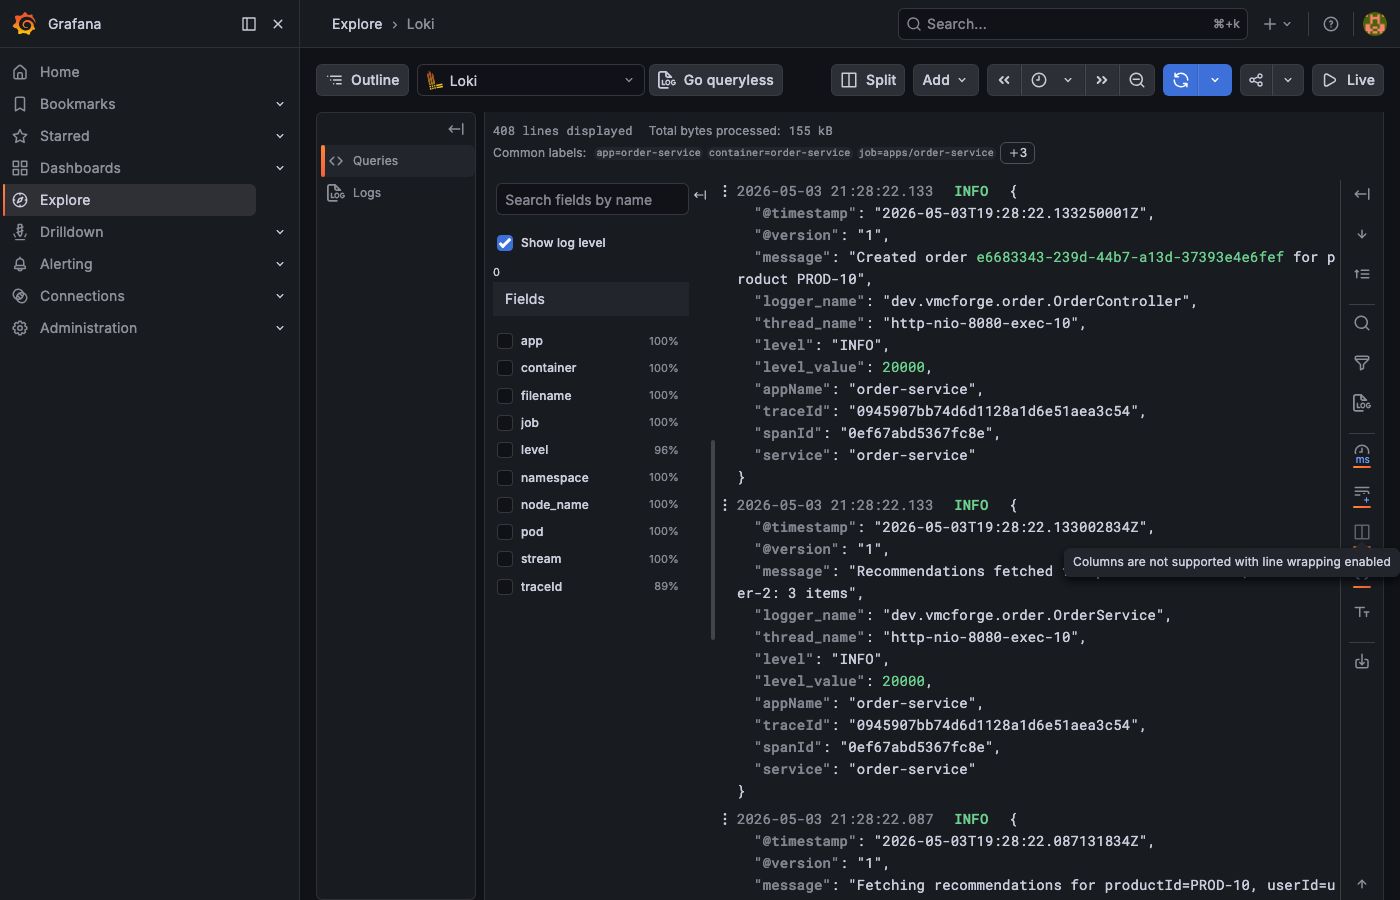
traceId field appears in the structured JSON. Click the Tempo link icon next to it to jump directly to that trace.
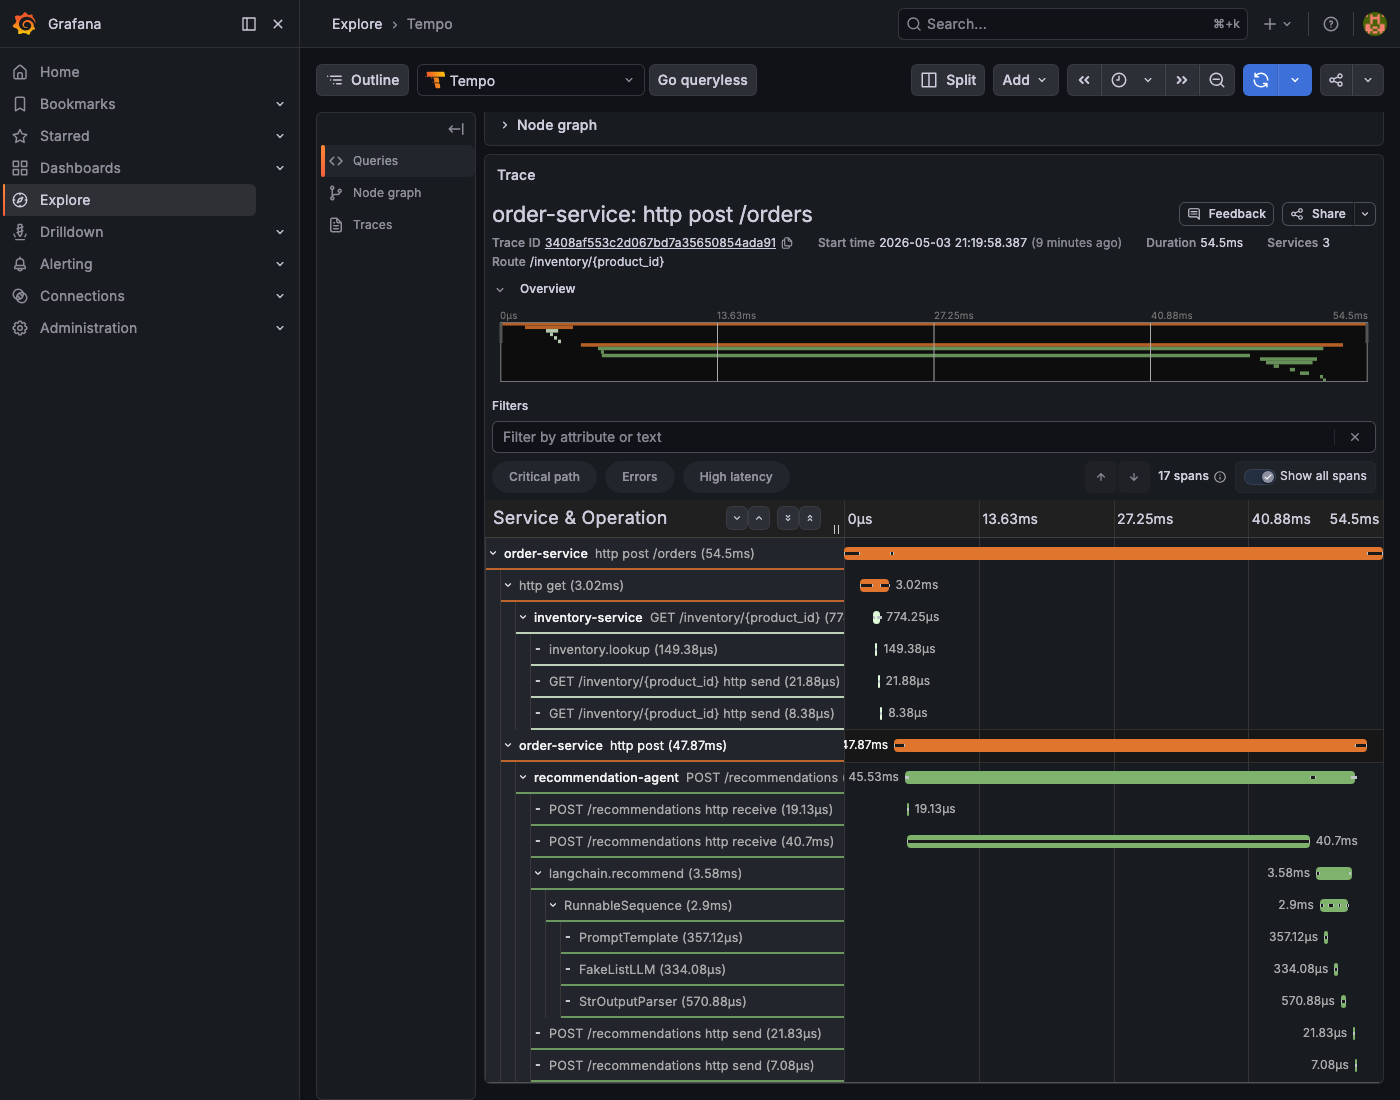
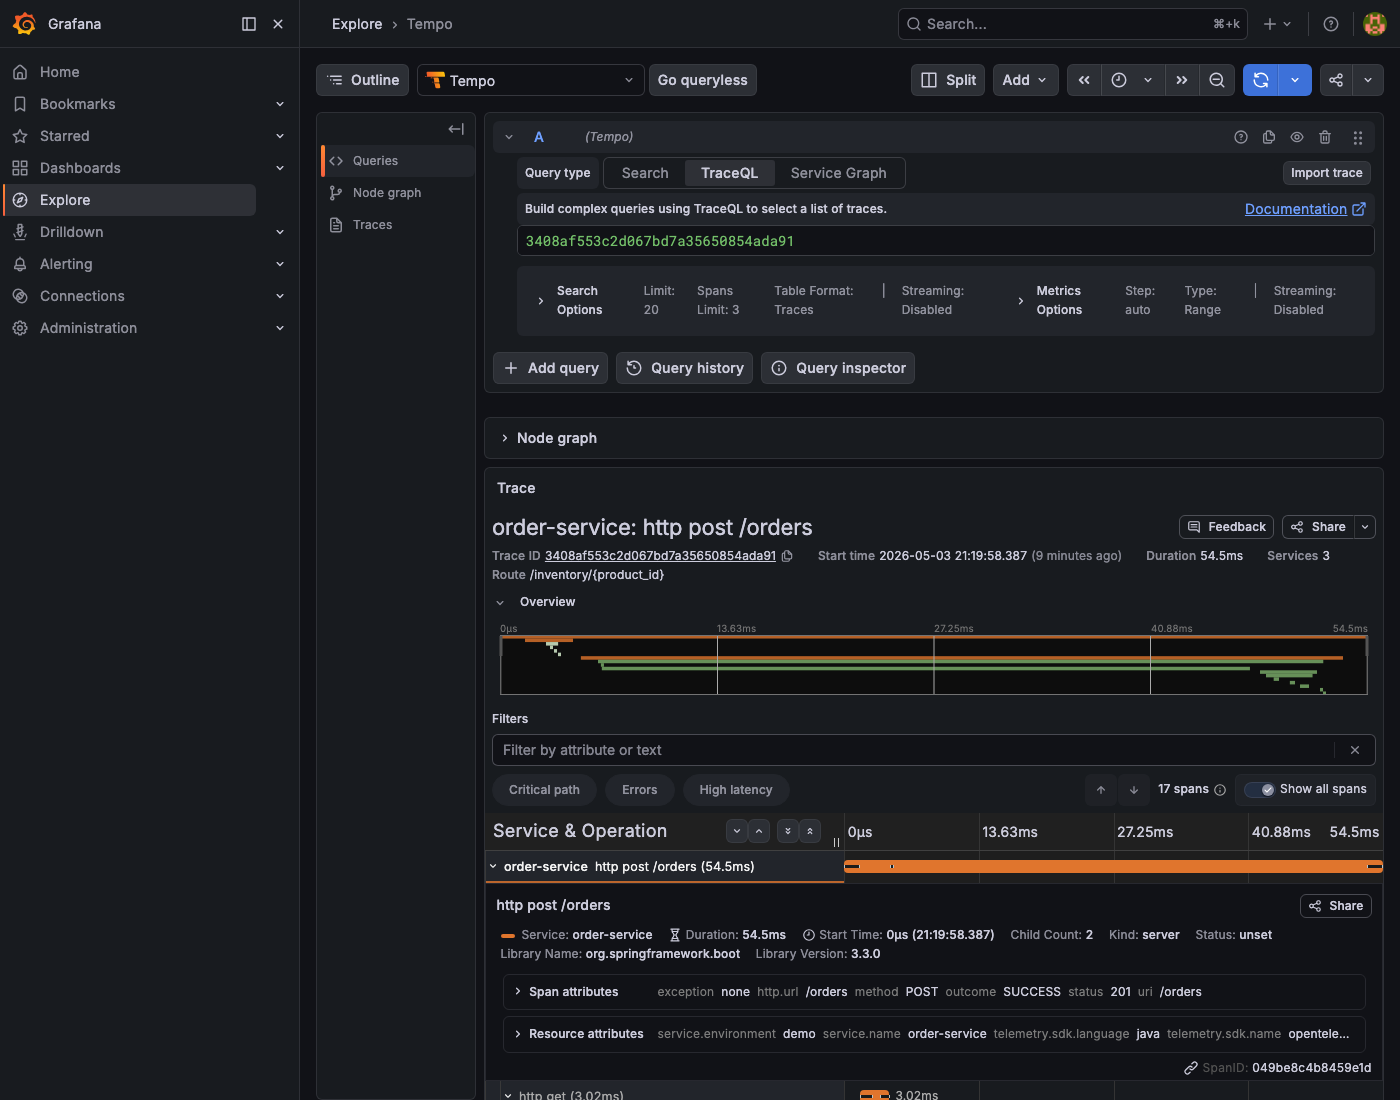
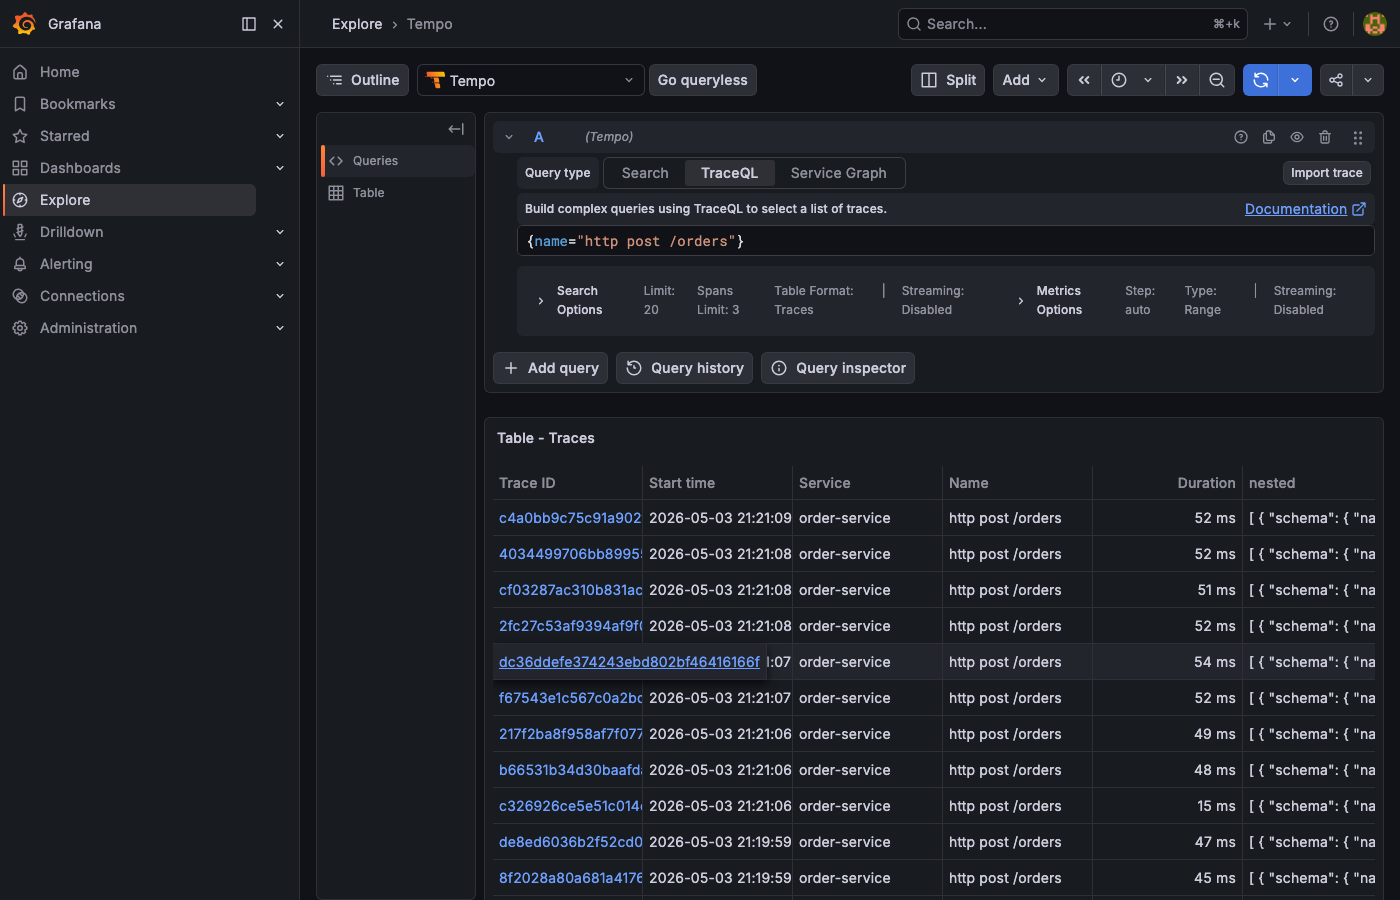
{name="http post /orders"}. The table lists every order trace with its duration, so outliers stand out.
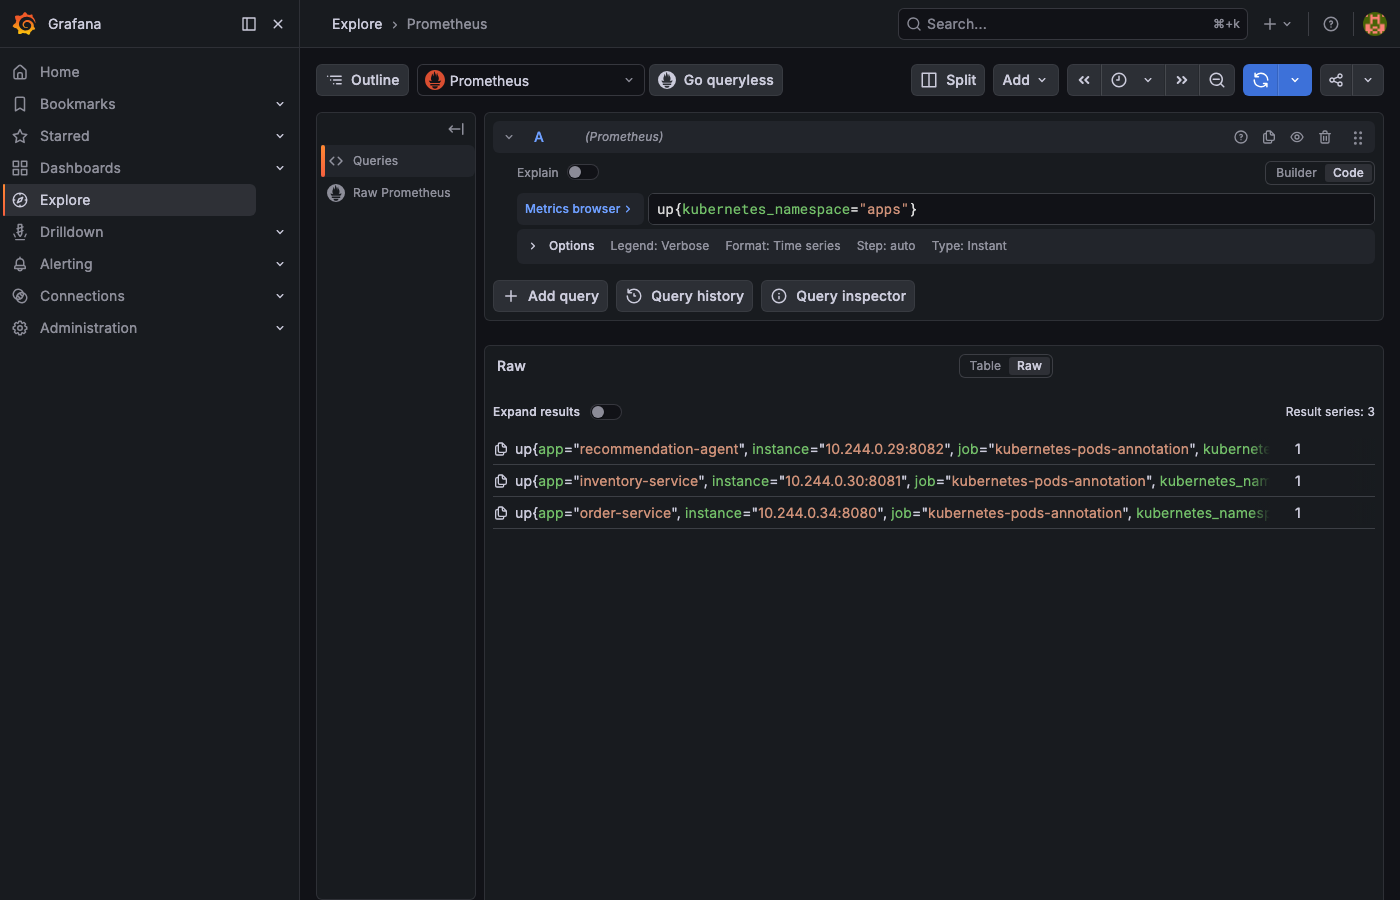
up{kubernetes_namespace="apps"}. The result should show Result series: 3, one per service, each returning 1 (UP).
Useful Prometheus queries once metrics are flowing:
# Request rate per service (last 5 minutes)
sum(rate(http_server_requests_seconds_count{job="kubernetes-pods-annotation"}[5m])) by (app)

# P95 latency across all services
histogram_quantile(0.95, sum(rate(http_server_requests_seconds_bucket[5m])) by (le, app))

# Error rate (non-2xx responses)
sum(rate(http_server_requests_seconds_count{status!~"2.."}[5m])) by (app)
Useful Loki queries:
# All logs for a specific trace
{namespace="apps"} | json | traceId="<paste-trace-id>"

# Errors across all services
{namespace="apps"} | json | level="error"

# LangChain recommendation calls with output
{app="recommendation-agent"} | json | message="recommendation_response"
Quick reference
Makefile targets
cluster-start + infra-up + build + deployHelm install: kube-prometheus-stack + loki + tempo + otel-collectorbuild all images into Minikube Docker daemonkubectl apply all service manifests + wait for rolloutGrafana :3000 · Prometheus :9090 · services :8080–808210 POST /orders → full chain — generates traces + logs + metricsk9s --context observability-demorebuild images + rollout restart (use after code changes)kubectl logs --follow for the specified serviceminikube delete -p observability-demo + cleanupCluster context — Minikube profile isolation
minikube start -p observability-demo --cpus 4 --memory 8192kubectl --context=observability-demo get pods -Amake kubeconfig-export → ~/.kube/observability-demo.yamlexport KUBECONFIG=~/.kube/observability-demo.yamlk9s --context observability-demok9s --kubeconfig ~/.kube/observability-demo.yamlInstrumentation — transport and port by runtime
HTTP/protobuf → :4318/v1/traces/actuator/prometheusgRPC → :4317/metricsgRPC → :4317 + OpenInference/metricstraceId (camelCase — all services)annotation: prometheus.io/scrape=trueThis setup covers a single Kubernetes cluster, which is enough for local development and many production workloads. Cross-cluster tracing adds new problems: traceparent crossing network boundaries managed by a service mesh, multiple OTEL Collectors routing spans across backends, and Grafana reading mesh telemetry as a fourth datasource.
The wiring itself is small. The bigger investment is the discipline to use the same correlation field across every service; with that in place, one Loki query returns every log line of a failed request and links to its trace.