When a bug only reproduces inside the cluster, the default response is adding log statements and redeploying: rebuild the image, push it, redeploy the pod, wait for the rollout, reproduce the issue. On a local application that cycle takes seconds; in Kubernetes it easily takes several minutes per attempt, and half a day is gone before the root cause is visible.
The JVM supports remote debugging through JDWP (Java Debug Wire Protocol). Once JDWP is enabled, IntelliJ or VS Code attaches directly to the JVM inside the pod and offers breakpoints, variable inspection, expression evaluation, and step execution against the real environment where the issue occurs.
How JDWP works
JDWP ships with the JVM. Enabling it requires one startup flag:
-agentlib:jdwp=transport=dt_socket,server=y,suspend=n,address=*:5005
What this does:
transport=dt_socket→ use a TCP socketserver=y→ the JVM opens the debug portsuspend=n→ the application starts normally without waiting for the debuggeraddress=*:5005→ listen on port5005
Once the application starts, the JVM waits for a debugger connection.
When the IDE attaches, we can:
- pause execution with breakpoints
- inspect variables
- evaluate expressions
- step through the code path
- inspect stack frames in real time
It’s the same debugger we already use locally, except the application is running inside Kubernetes.
JDWP has no authentication and no encryption. Anyone who can reach the port controls the JVM process, so the debug configuration must stay out of production.
Keeping debug configuration out of production
The cleanest approach keeps JDWP entirely outside the base deployment configuration, so production manifests never reference it. Kustomize overlays inject the debug configuration only in the environments that need it.
Example structure:
k8s/
  base/
    deployment.yaml
    service.yaml
    kustomization.yaml

  overlays/
    dev/
      kustomization.yaml
      debug-patch.yaml

    stg/
      kustomization.yaml
      debug-patch.yaml

    prod/
      kustomization.yaml
The base deployment contains no JVM debug settings. The overlay adds the JDWP configuration only where needed.
overlays/dev/kustomization.yaml
apiVersion: kustomize.config.k8s.io/v1beta1
kind: Kustomization

resources:
  - ../../base

patches:
  - path: debug-patch.yaml
overlays/dev/debug-patch.yaml
apiVersion: apps/v1
kind: Deployment

metadata:
  name: debug-demo

spec:
  template:
    spec:
      containers:
        - name: app
          env:
            - name: JAVA_TOOL_OPTIONS
              value: "-agentlib:jdwp=transport=dt_socket,server=y,suspend=n,address=*:5005"

          ports:
            - containerPort: 5005
              name: debug
Deploying the development environment:
kubectl apply -k k8s/overlays/dev
Deploying production:
kubectl apply -k k8s/overlays/prod
Production inherits the base configuration only, so the debug port never exists there.
Use JAVA_TOOL_OPTIONS rather than JAVA_OPTS. The JVM reads JAVA_TOOL_OPTIONS directly regardless of how the application starts, so it works across different containers and launch scripts.
The demo project
The companion project is on GitHub at github.com/valeriomc/remote-debug-kubernetes. It’s a Spring Boot order service with a pricing engine that has a deliberately simple bug, introduced just to have something concrete to step through with the debugger.
Requirements:
- minikube
- kubectl (v1.14+ for built-in kustomize support)
- Docker
- k9s (optional, but useful for the walkthrough below)
Clone and start everything:
git clone https://github.com/valeriomc/remote-debug-kubernetes
cd remote-debug-kubernetes

make all
make all starts a minikube profile named remote-debug, builds the image inside minikube’s Docker daemon (no registry push needed, imagePullPolicy: Never), and deploys the dev overlay. When it finishes, the pod is running and JDWP is listening on port 5005 inside the container.
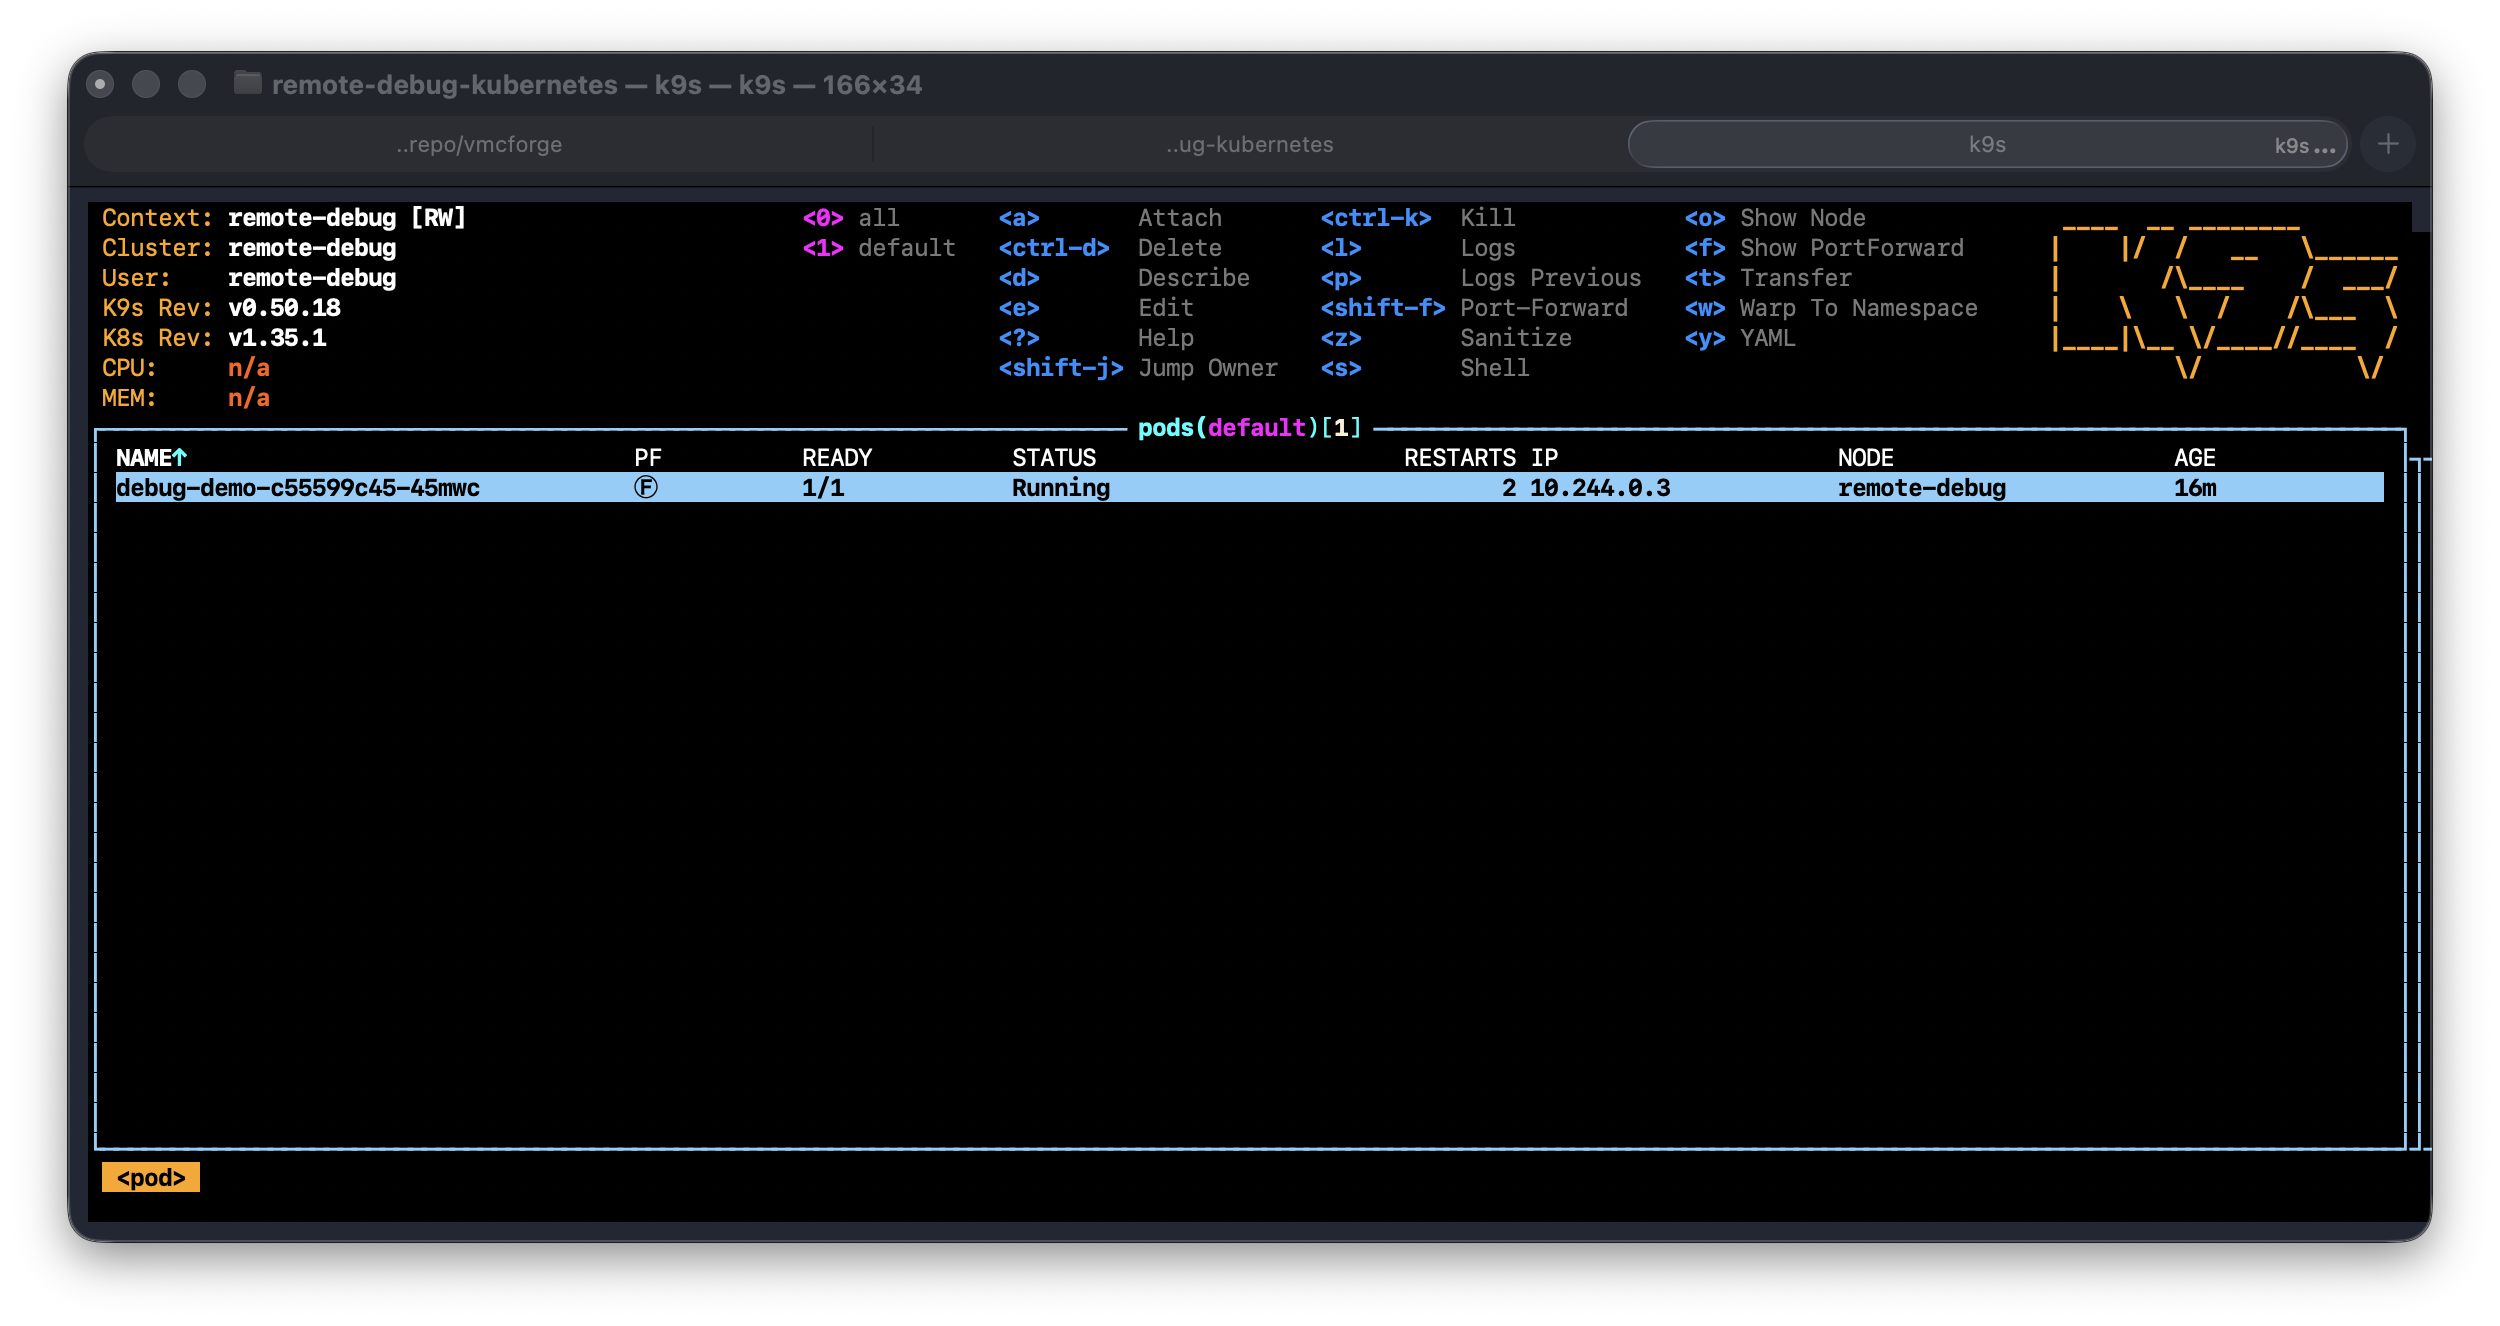
You can verify the deployment with:
make k9s
# or: k9s --context remote-debug
Opening the debug tunnel
The debug port exists inside the pod, so we need a tunnel from the local machine to Kubernetes.
kubectl port-forward handles that.
make debug
The target runs:
kubectl --context=remote-debug port-forward deploy/debug-demo 5005:5005
Keep that terminal running, or start the equivalent port-forward from k9s.
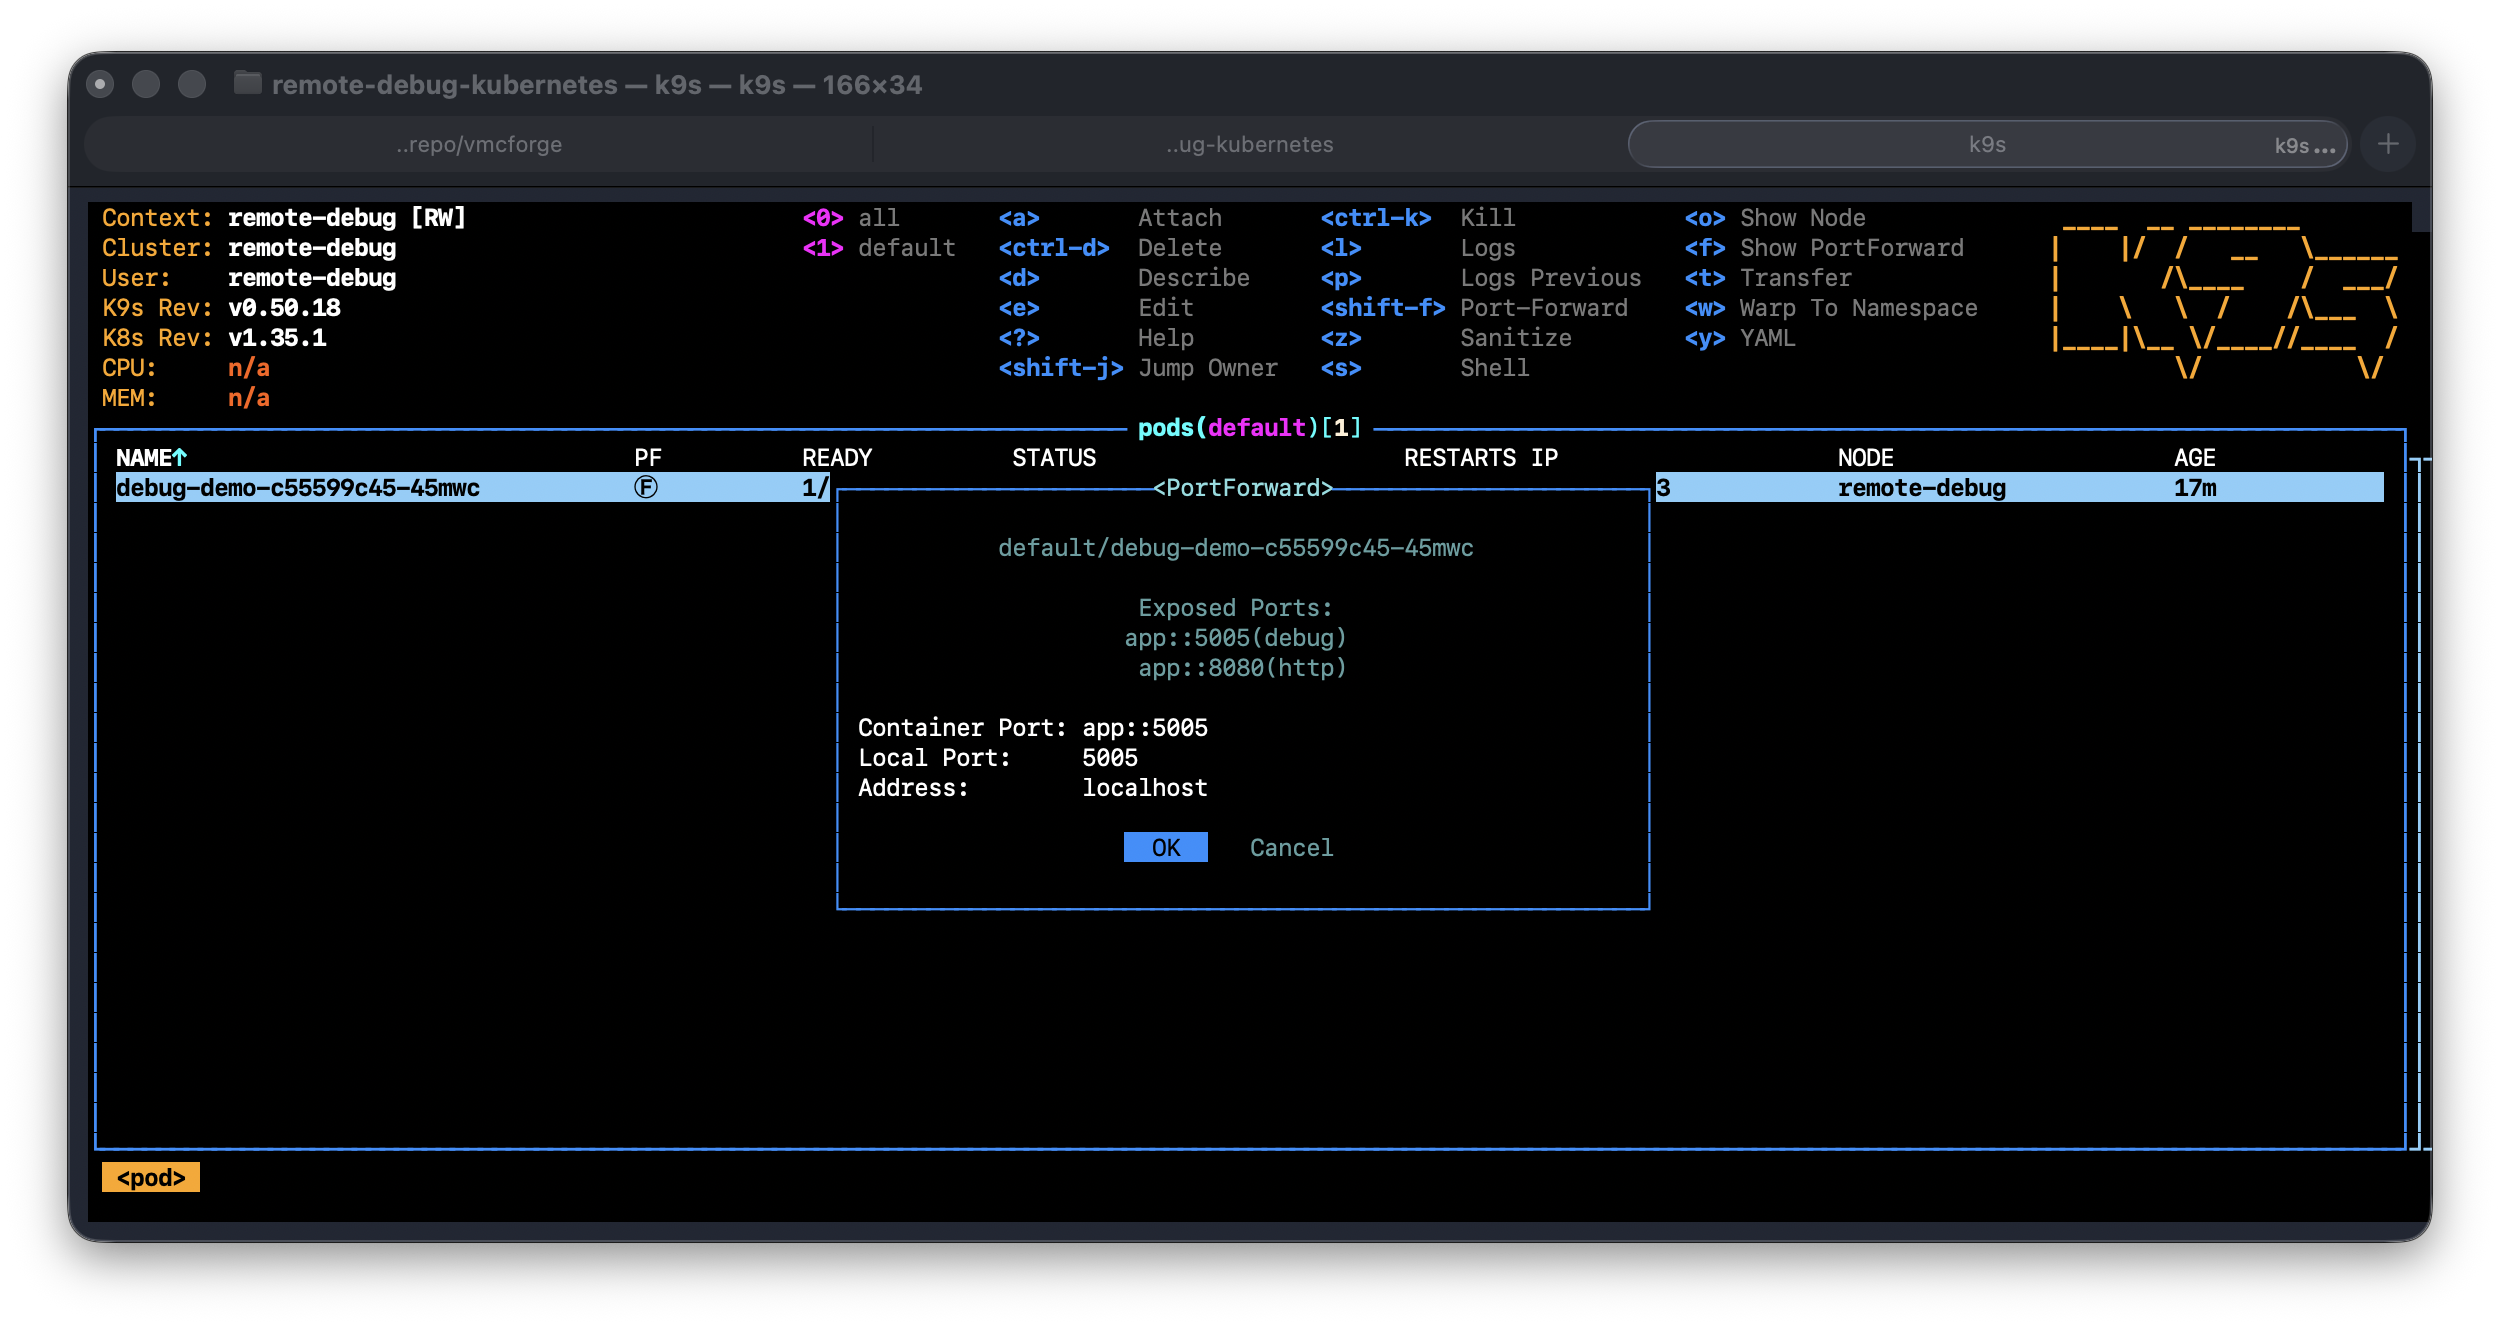
Now localhost:5005 on our machine points to the JVM inside the pod, through a temporary local tunnel.
make debug kubectl port-forward deploy/debug-demo 5005:5005 leave running — tunnel stays open Connecting IntelliJ IDEA
Inside IntelliJ:
- Run → Edit Configurations → + → choose Remote JVM Debug
- Host:
localhost, Port:5005 - Debugger mode: Attach to remote JVM
- Use module classpath: select your project module
- Click OK, then hit the debug button
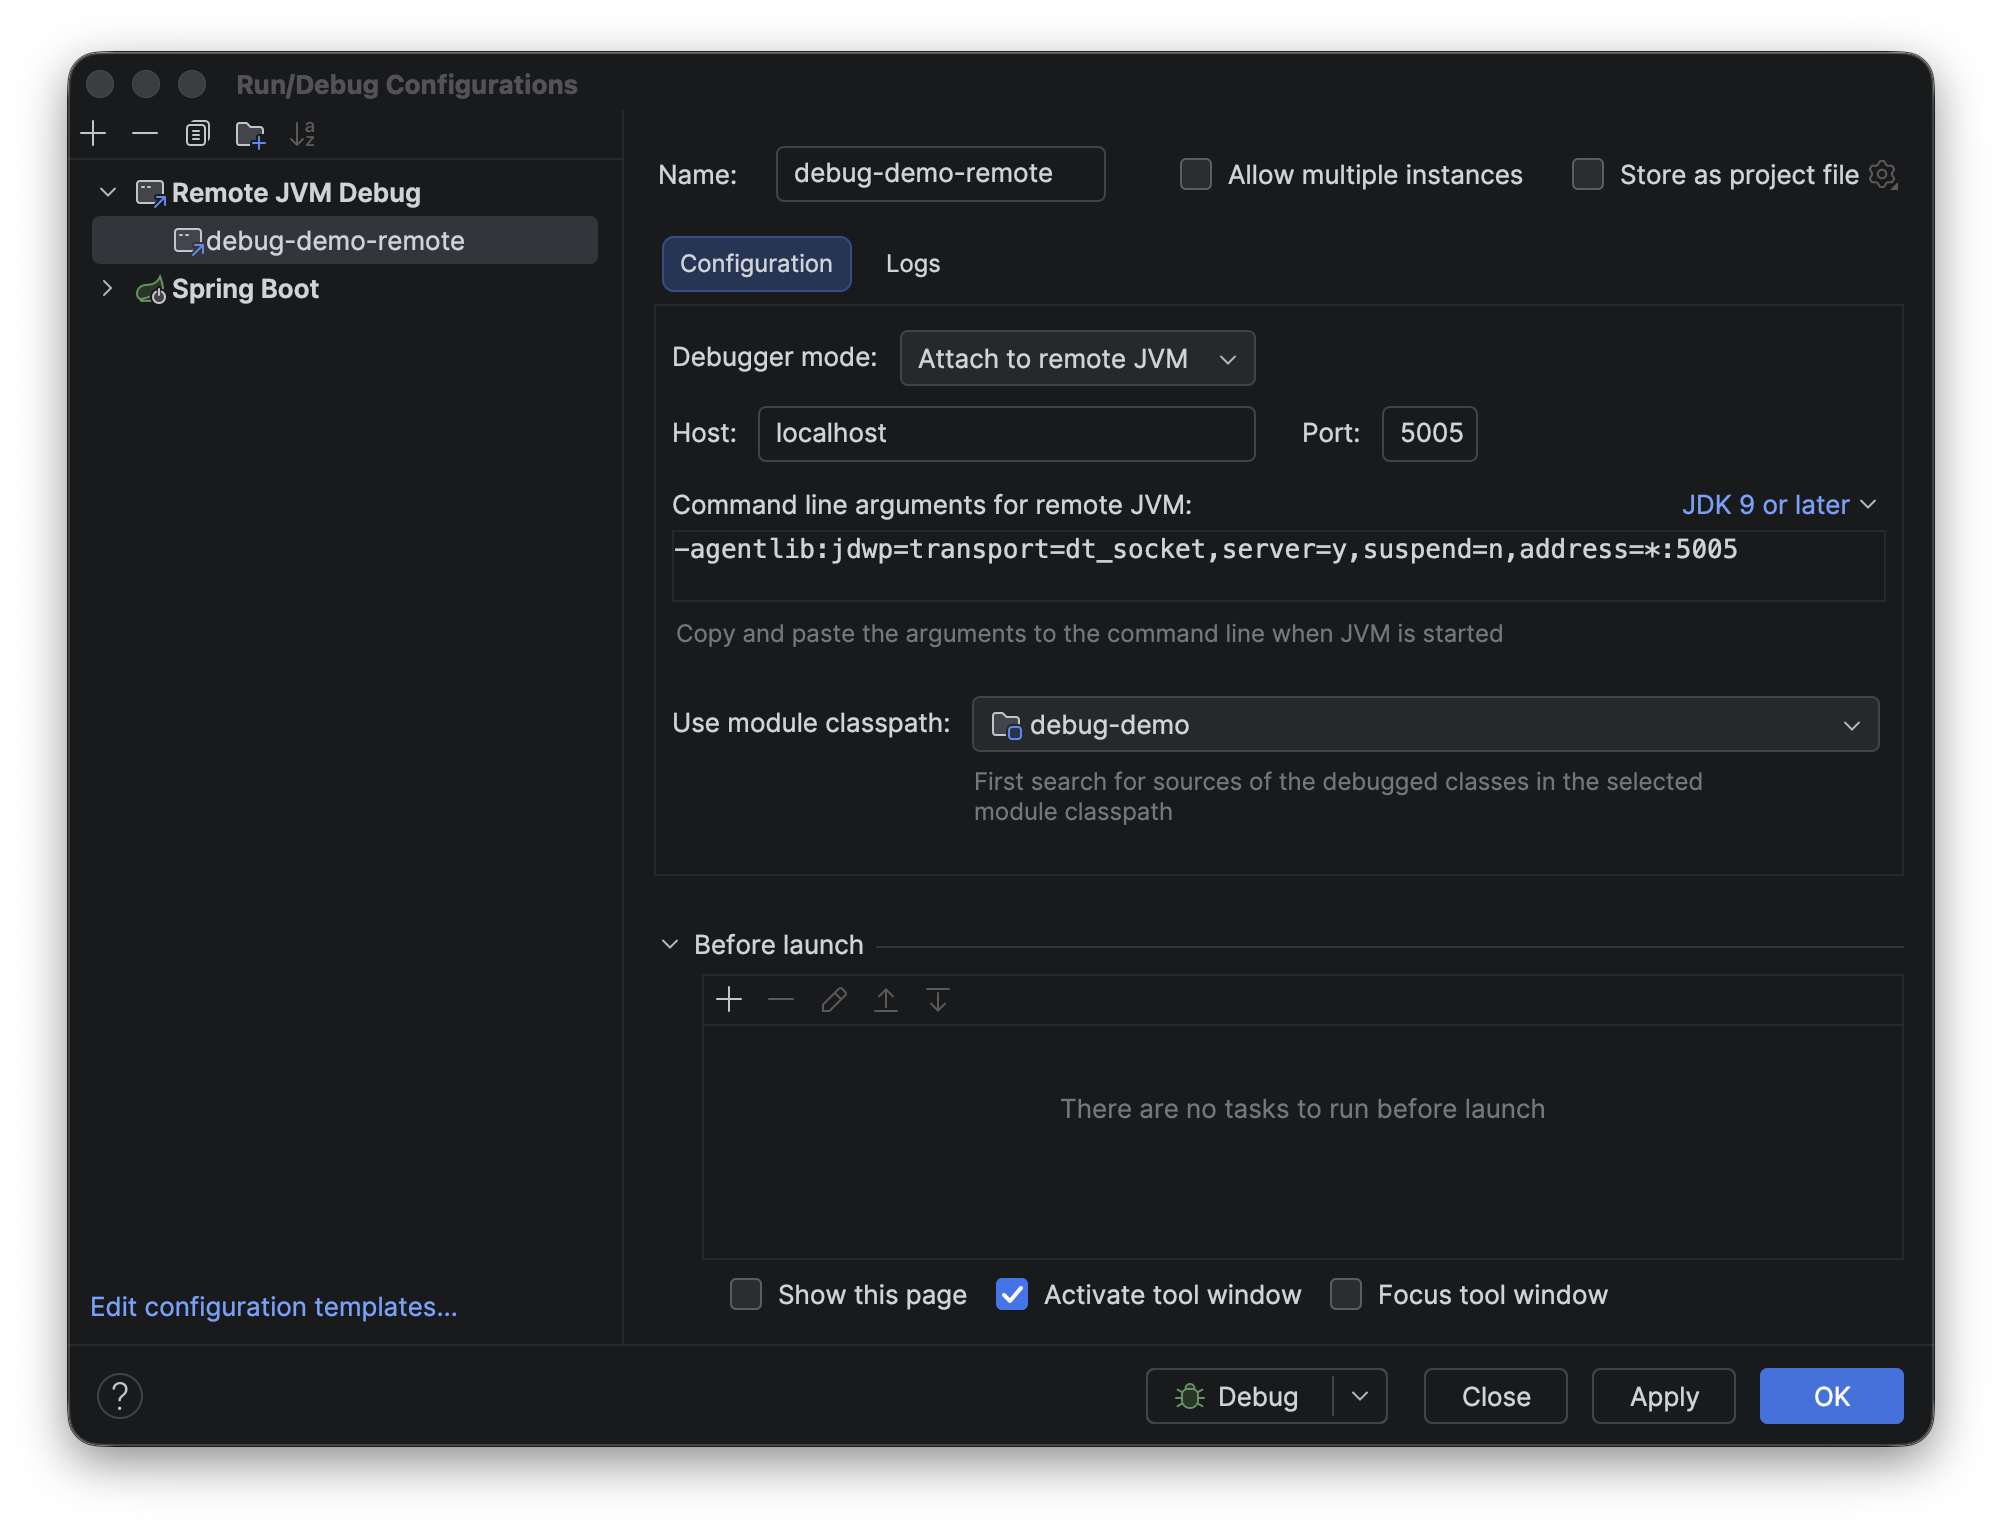
If everything is configured correctly we’ll see:
Connected to the target VM
At that point our breakpoints are live inside the Kubernetes pod.
Connecting VS Code
Add this to .vscode/launch.json:
{
  "type": "java",
  "name": "Attach to Kubernetes JVM",
  "request": "attach",
  "hostName": "localhost",
  "port": 5005
}
Run the configuration from the Debug panel and VS Code will attach through JDWP exactly the same way IntelliJ does.
Finding the bug
The pricing engine contains a boundary condition issue.
Gold-tier customers should receive a 10% discount for orders equal to or greater than $500.
The implementation looks like this:
if (subtotal.compareTo(GOLD_THRESHOLD) > 0) {
The problem is:
500.01works700.00works- exactly
500.00fails
Nothing crashes and the response looks valid, so the bug is easy to miss without a debugger.
Set a breakpoint inside PricingEngine.goldDiscount() at the comparison line and send a request:
curl -X POST http://localhost:8080/orders \
  -H "Content-Type: application/json" \
  -d '{"customerId":"c1","tier":"gold","subtotal":500.00}'
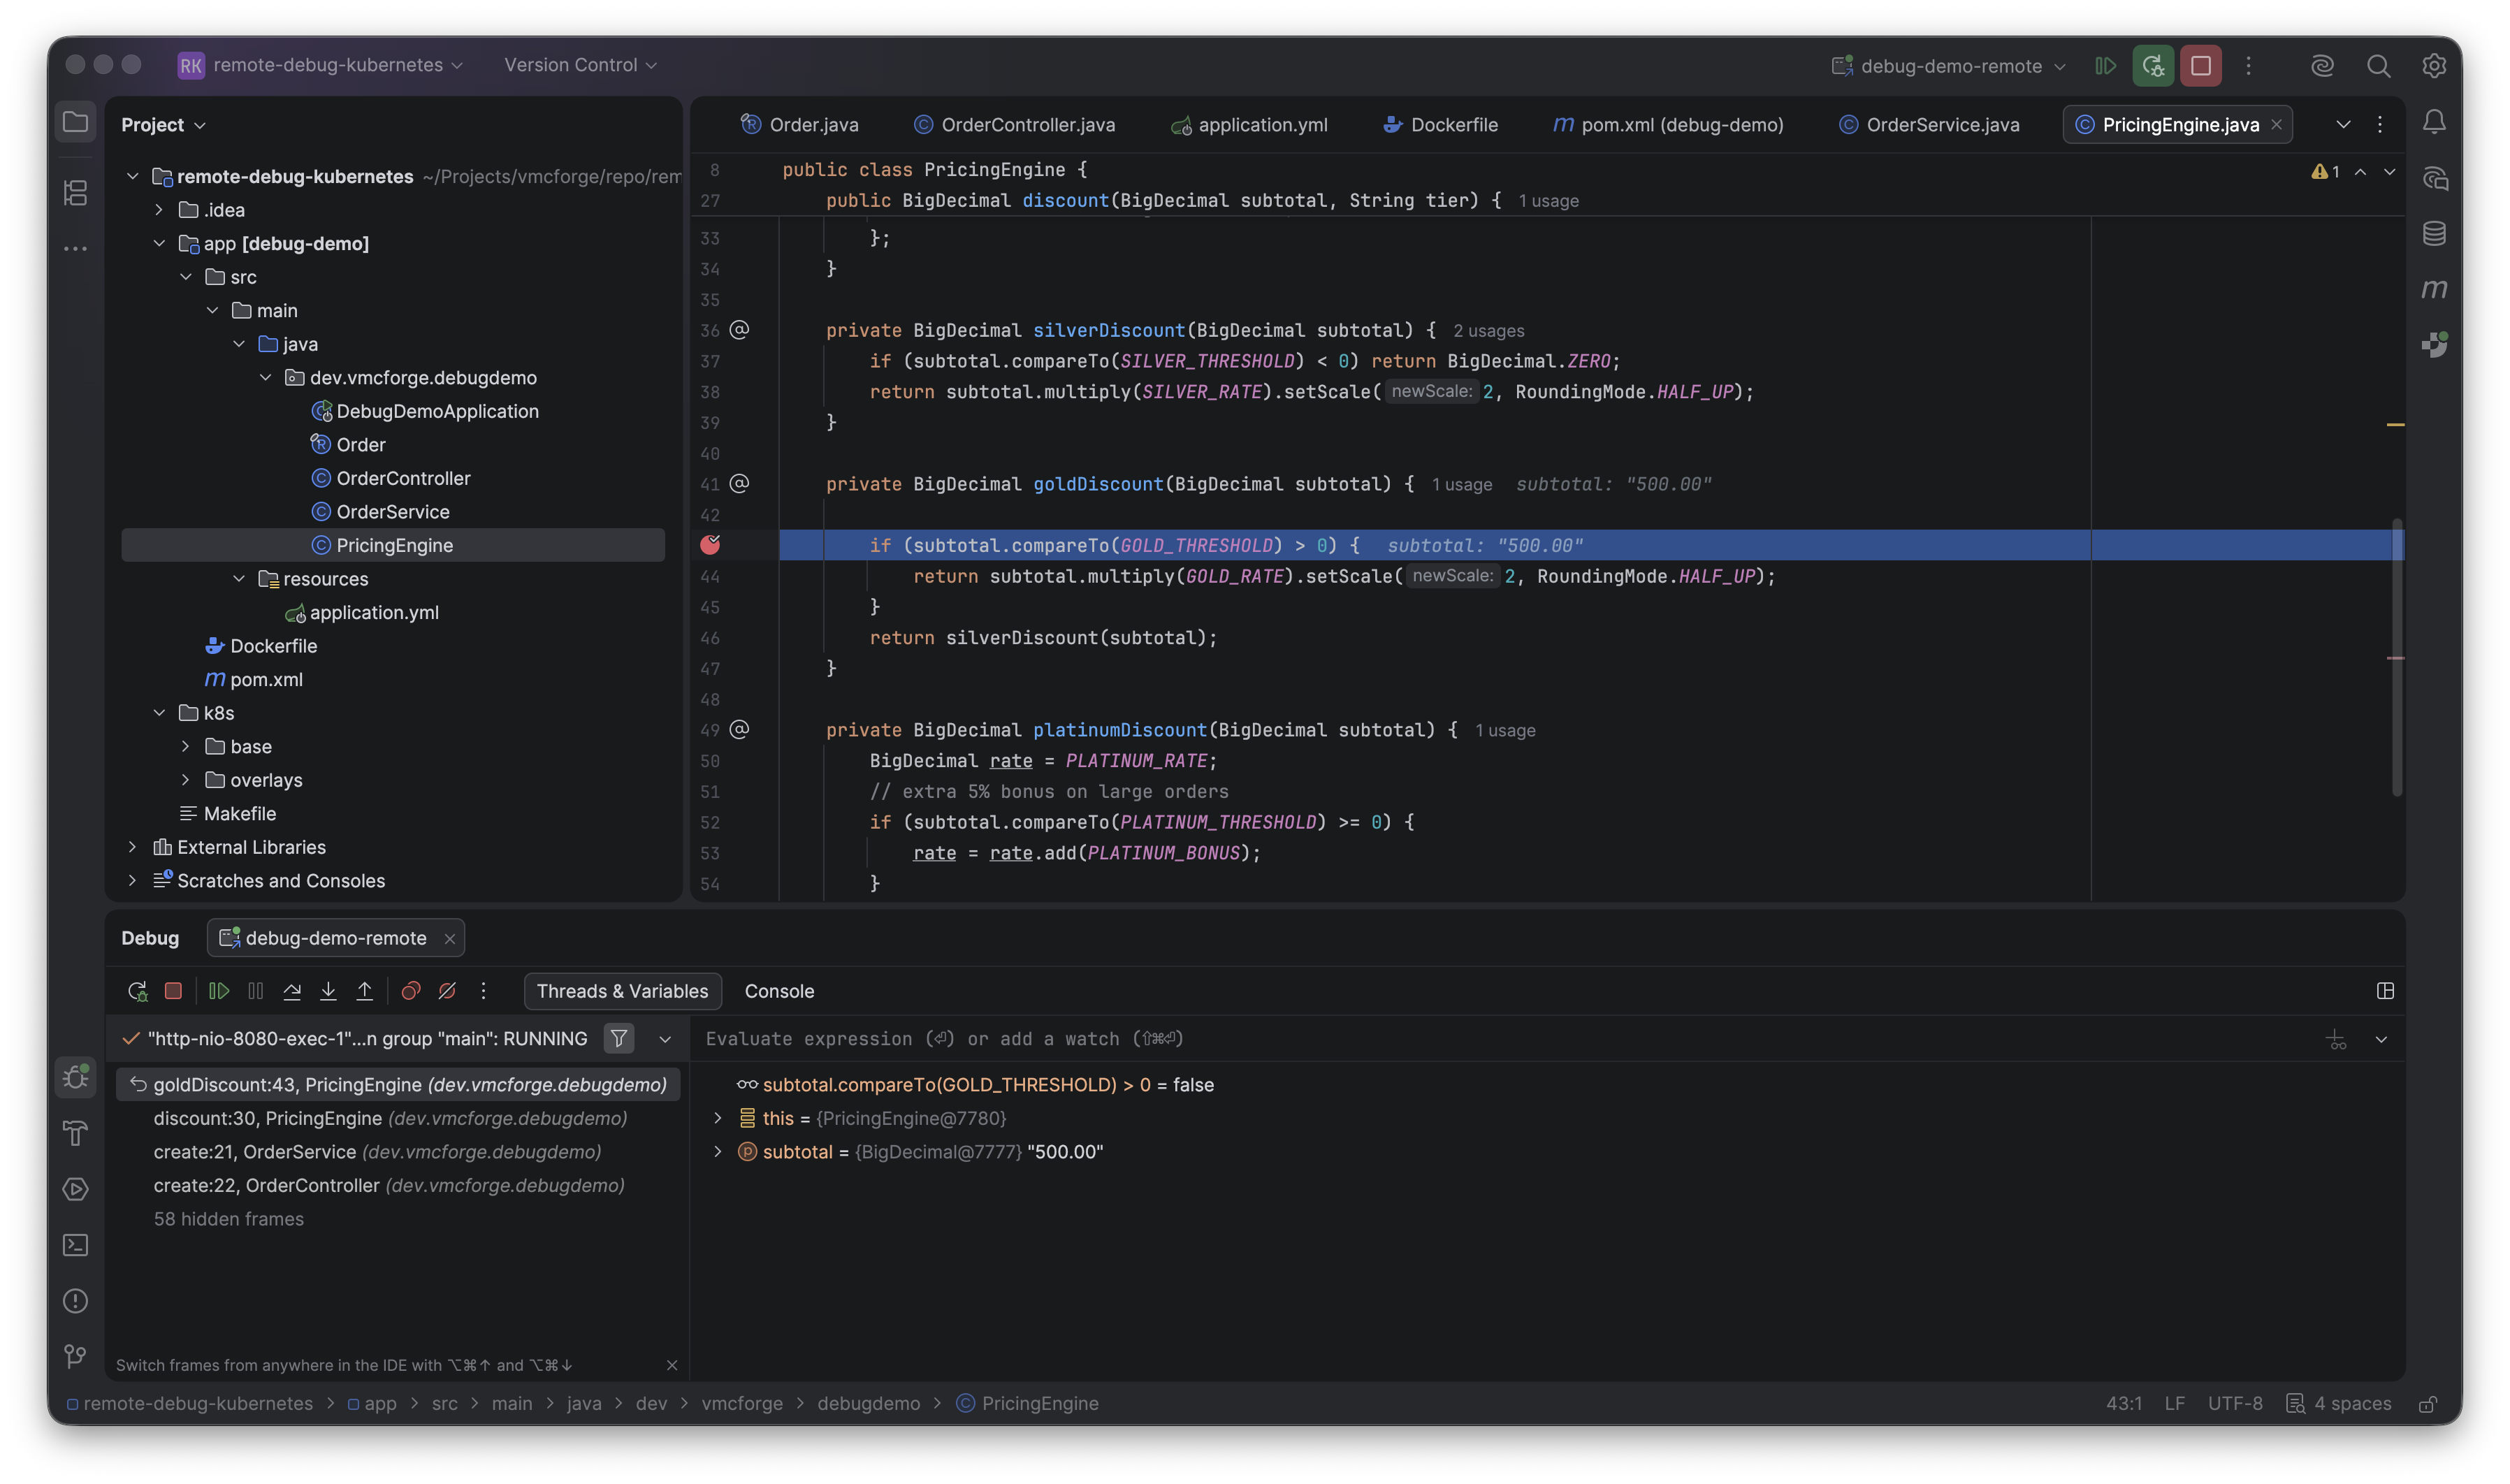
The breakpoint fires inside the running pod, and the variables panel shows the problem:
subtotal = 500.00GOLD_THRESHOLD = 500.00compareTo()returns0
The condition checks for > 0, so the branch never executes.
The fix changes one character:
>= 0
Rebuild and redeploy:
make redeploy
The updated container rolls out and the issue disappears.
The Python equivalent: DAP
The demo project includes a second service written in Python that follows exactly the same pattern. Instead of JDWP, Python uses the Debug Adapter Protocol (DAP), specifically via debugpy. The idea is identical: expose a debug port in the dev overlay, forward it with kubectl port-forward, and attach from the IDE.
The Kubernetes side looks the same. The only differences are the env var and the port: debugpy listens on 5678 by default and can be configured to wait for a client before starting, which catches early initialization. The overlays, the port-forward, and the IDE attach follow the same workflow.
Conclusions
The pricing bug in the demo is intentionally simple. An off-by-one in a compareTo would be caught locally in minutes, without Kubernetes in the loop; the demo exists to give the walkthrough a concrete application.
Remote debugging pays off when the environment itself is part of the problem: a service that talks to an internal message broker we can’t run locally, configuration injected from a secrets manager or a sidecar that doesn’t exist on our machine, network policies and DNS that behave differently inside the cluster, or an issue that only surfaces under staging load.
In those cases no local equivalent exists to attach to. JDWP attaches the debugger to the running process in the real environment without rebuilding anything, and once the configuration sits in the dev and staging overlays it costs nothing to keep.